Data analysis Part 3: Population and sample standard deviation
Data analysis Part 3: Population and sample standard deviation
The formula used for both the standard deviations are quote similar as can be seen below
The steps in both the formulas are same except the denominator.
In case of population standard deviation, denominator is N i.e. total no. of data points, where as in case of sample standard deviation, denominator is (n-1) i.e. total no. of data points minus 1.
- When to use population and/or sample standard deviation
If select 100% of the data points (whole population) for the estimation of standard deviation, use population standard deviation.
If a part of the data point (part of the whole population) is used for the estimation of standard deviation, sample standard deviation is used.
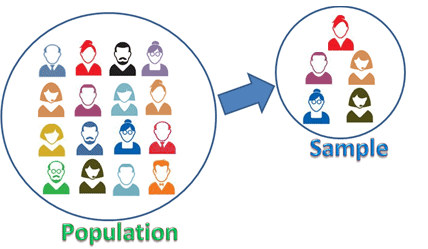
Example of population and sample
In we want data about all Indians, we have to gather data from each individual (1.5 billion), which is pretty difficult. Population standard division is applicable here.
Instead data from a small population(upto 5% of 1.5 billion) is taken many times, which is assumes to represent the total population. Sample standard division is applicable here.
General election result (100% of vote casted) vs exit poll result (upto 5% of vote casted) may represent the scenario better. Exit poll result matches election result if sample representation is proper, if not many times both the results differs significantly.
Photo credit: www.livehindustan.comHowever for a country with small population, it is practically possible to collect data from each individuals.


Comments
Post a Comment